Marketing Cloud Personalization has a huge potential in gathering customer information within sitemap. However, being a code-based tool, it requires technical JavaScript knowledge, especially with more complex solutions. Complex solutions means also more edge cases and exceptions, that we need to handle and test. That’s why debugging is so important. There are several ways to debug and troubleshoot the sitemap in Personalization. Check the article to discover the most powerful solutions and some useful tips!
Table of Contents
- Debug with Visual Editor
- Debug with Evergage setLoggingLevel
- Debug with DevTools
- Load sitemap without WebSDK and plugin
- Debugging best practices
Debug with Visual Editor
The most common and UI-friendly tool allowing us to test the sitemap is the Sitemap module in the Visual Editor. It is also a Salesforce-recommended way to develop a sitemap. We will follow the process described in the developer documentation.
When to use the Visual Editor
Debugging a sitemap with Visual Editor is the simplest way to do so. You have quite a friendly UI, you can edit the sitemap in real time, see the output in the left column, and check for errors at the right. It is a good way to find and quickly fix small issues or to add some content and test it without precise debugging.
If you begin the journey with the sitemap development, the Visual Editor is a friendly sandbox space where you can test your solutions without making live changes (of course if you won’t click the save button 😉).
⚠ For me the Visual Editor is not a fully stable solution. Sometimes I’ve encountered issues with loading this tool, catching some operations on the website, and with error messages that are not so precise and can be troublesome.
How to use the Visual Editor Sitemap module
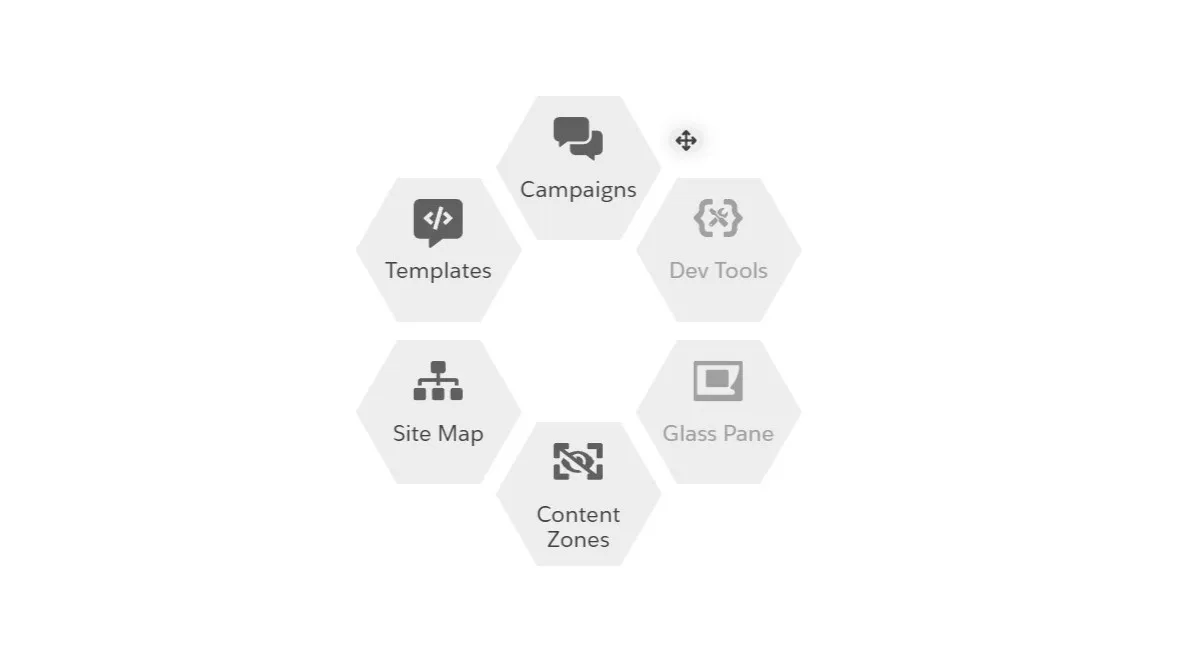
To open the Sitemap module in the Visual Editor, you must have the Salesforce Interactions SDK plugin installed. Open the plugin and check if it detected the sitemap beacon. If yes, turn on the “Visual Editor” option. You can find the Sitemap module in the hex circle in the bottom right corner.
Let’s go through all the functionalities that we can see here:
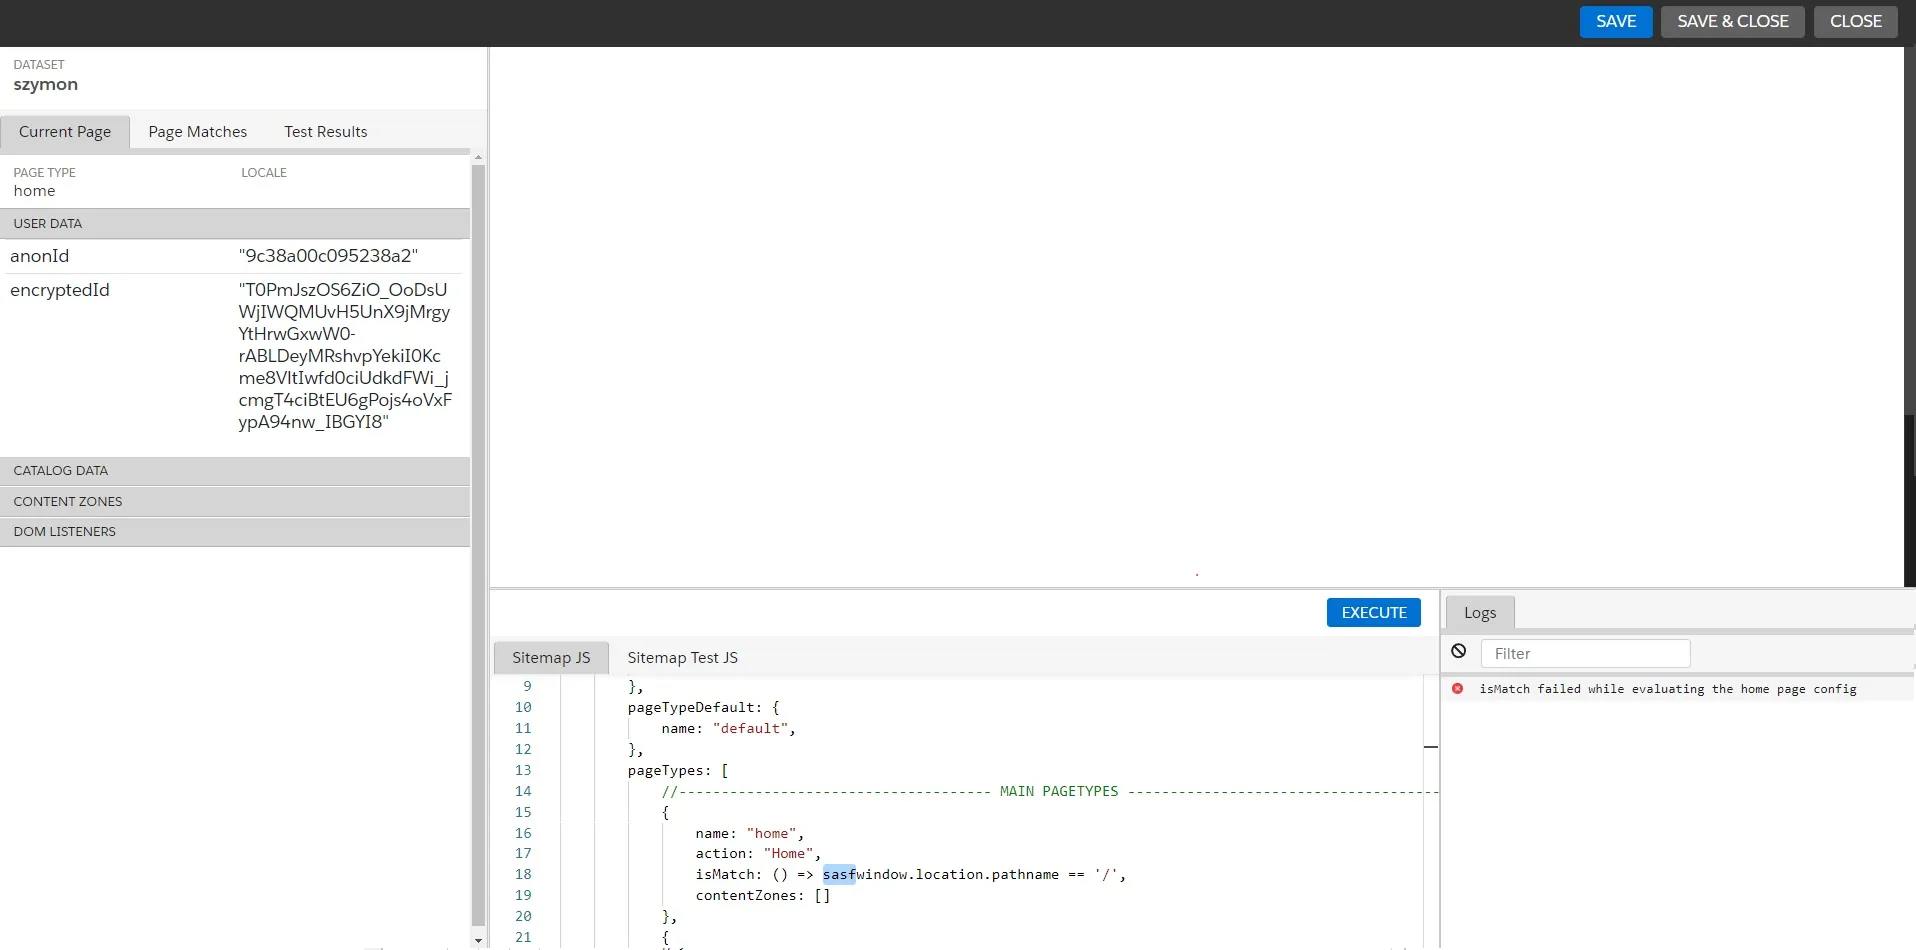
- In the left column, we can see on what dataset we are working. We can also find the Current Page tab where you can find the information about the current page that the sitemap was able to collect. They are sorted into sections. User Data stores data about the user and his attributes. Catalog Data stores data about products. Content Zones store data about recognized content zones. DOM Listeners store data about recognized listeners.
- Here you can also view the Page Matches tab. There you can find all of the pageTypes and see what pageType was matched on the current page.
- The row at the bottom is split into two parts. In the Sitemap part, you can write and execute the code. The second part shows the Logs when an error or issue occurs.
Debug with Evergage setLoggingLevel
Now we move into more technical stuff. Visual Editor is not the only way to debug the sitemap. What’s more, it does not offer some cool options that the Marketing Cloud Personalization gives us. In my country, we say “dupa-driven development” when someone uses the console.log() function with the “dupa” word in it (don’t google it, please). Well, it is a supreme weapon when it comes to the logging the information that we want, but we can use the another, dedicated function in the Marketing Cloud Personalization.
One of the ways to leverage debug features is to use the function Evergage.setLoggingLevel or SalesforceInteractions.setLoggingLevel. Never heard of it? Don’t worry, I haven’t found this in the entire Marketing Cloud Personalization documentation. But it is in the… Data Cloud Documentation.
When to use the setLoggingLevel
setLoggingLevel function is a perfect option to add every time you are working on the sitemap. You can declare it in the sitemap and it will turn on the debug mode on every page. It is a perfect solution for tracking the event-sending behavior, especially if you work on sending events with catalog metadata or work on passing user identities and attributes. You can see not only events that are passed, but also the whole object that is sent, with catalog and user payload.
There are several levels here, following the documentation:
setLoggingLevel(“error”)– logs the errors in the consolesetLoggingLevel(“warn”)– logs the errors and potential issuessetLoggingLevel(“info”)– logs the errors, potential issues, and informationsetLoggingLevel(“debug”)– logs the errors, potential issues, and information and provides debug information such as event sendssetLoggingLevel(“trace”)– logs finer-grained information than debug mode
If you are quite familiar with the browser Console tool, using the setLoggingLevel(“debug”) and setLoggingLevel(“trace”) can boost your work. It allows you to avoid manually tracking events in the Network tab or switching to the Event Stream to check the event payload. Using the setLoggingLevel function is a perfect thing to implement into your workflow.
How to use sitemap debug and trace mode
To use the setLoggingLevel(“debug”) or setLoggingLevel(“trace”) in Marketing Cloud Personalization, simply add this code to your sitemap after the init declaration, for example like this:
Evergage.init({
cookieDomain: "example.com"
}).then(() => {
Evergage.setLoggingLevel(trace)
const config = {
…
},
...
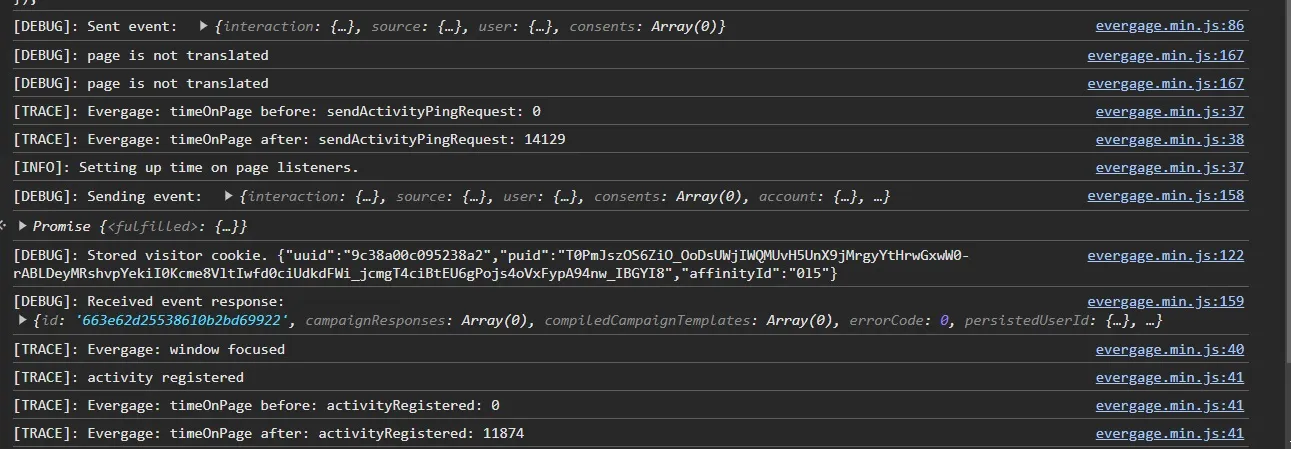
});Now, when you inject the SDK, every event will be specifically logged in the Console. With the information about the metadata and user that triggered the event. There will be also information about issues with the events if they occur.
⚠ Remember that declaring the debug mode in the sitemap will occur for every user that uses the sitemap. If you are using it on the production dataset, all your clients will see these messages in their browser consoles. That’s why it is good to know more about debugging with DevTools possibilities.
Debug with DevTools
Now let’s call in the big guns. setLoggingLevel function is only one way to leverage the interesting functions from the Evergage or SalesforceInteractions namespace. And the console is only one of the cool features of the developer tools in the browser.
DevTools offers us functionalities that we can compare to a simple IDE. You can find here the Sources section, where the sitemap is stored. You can use the breakpoints to stop the sitemap code execution and check how the data is stored and passed. You can even check and retrieve specific API calls that are triggered by the sitemap.
If you know how to use DevTools, you have some frontend experience, or just want to push your skills to a higher level, try enrolling the DevTools in your workflow. They are the ultimate tool to debug the Marketing Cloud Personalization Sitemap.
And I will show you why they are so cool. 😉
Useful functions in the Console
Let’s start with other useful functions, that are available in the Evergage and SalesforceInteractions namespace.
Evergage.getConfig() / SalesforceInteractions.mcis.getSdkConfig() – gives you useful information, such as account and dataset name, cookieDomain, dataset default currency, and a list of identity attributes, the SalesforceIntractions one provides the same information, but in a more condensed JSON object.
.BZUHO12i_8OqnT.webp)
Evergage.getCurrentPage() – returns the information about the current pageType, about action or interaction that is triggered by the pageType, and information about declared content zones, current URL, referrer URL, and user information
.8-xAXwqh_1gNbSN.webp)
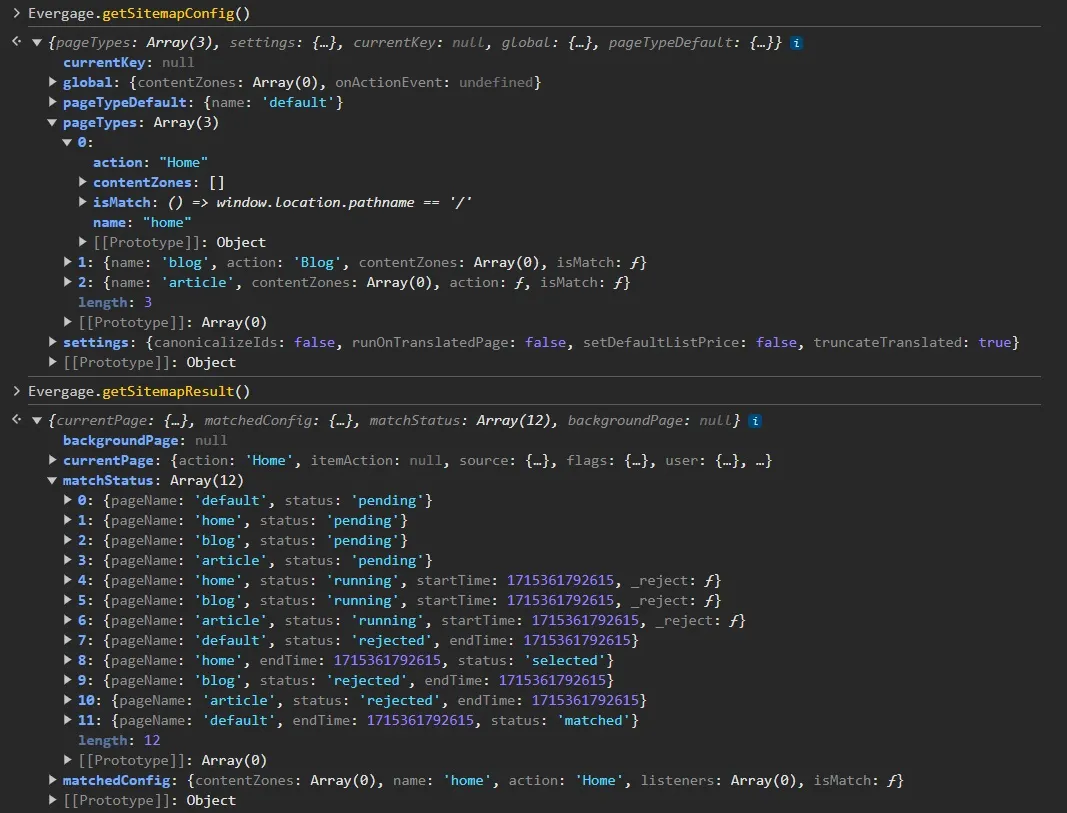
Evergage.getSitemapConfig() / SalesforceInteractions.mcis.getSitemapConfig() – returns the whole config with global, pageTypeDefault and all pageTypes configuration
Evergage.getSitemapResult() / SalesforceInteractions.mcis.getSitemapResult() – returns the current sitemap state with pageTypes match status and getCurrentPage() results
Evergage.getState() – aggregates the response similar to three other functions (getCampaignResponses(), getSitemapConfig() getSitemapResult())
.8Xz_xtCn_2w2DTL.webp)
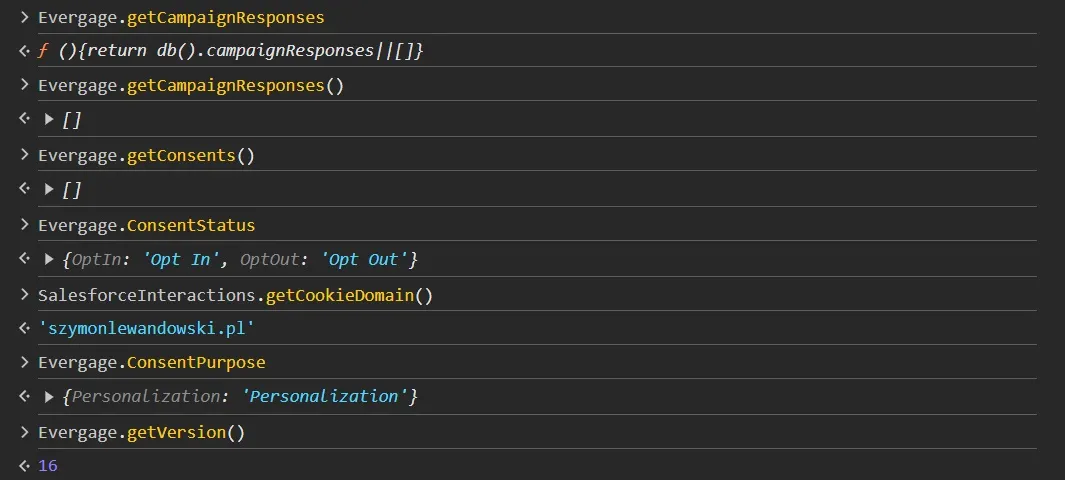
Evergage.getCampaignResponses() / SalesforceInteractions.mcis.getCampaignResponses() – returns the information about responses from the campaigns
Evergage.getVersion() – returns the current beacon version, useful to check if the loaded sitemap is up to date after some updates in the MCP.
Evergage.ConsentPurpose / SalesforceInteractions.mcis.ConsentPurpose – returns object that stores declared consent purposes
Evergage.ConsentStatus / SalesforceInteractions.ConsentStatus – returns object that stores declared consent statuses
SalesforceInteractions.getCookieDomain() – returns the declared cookie domain
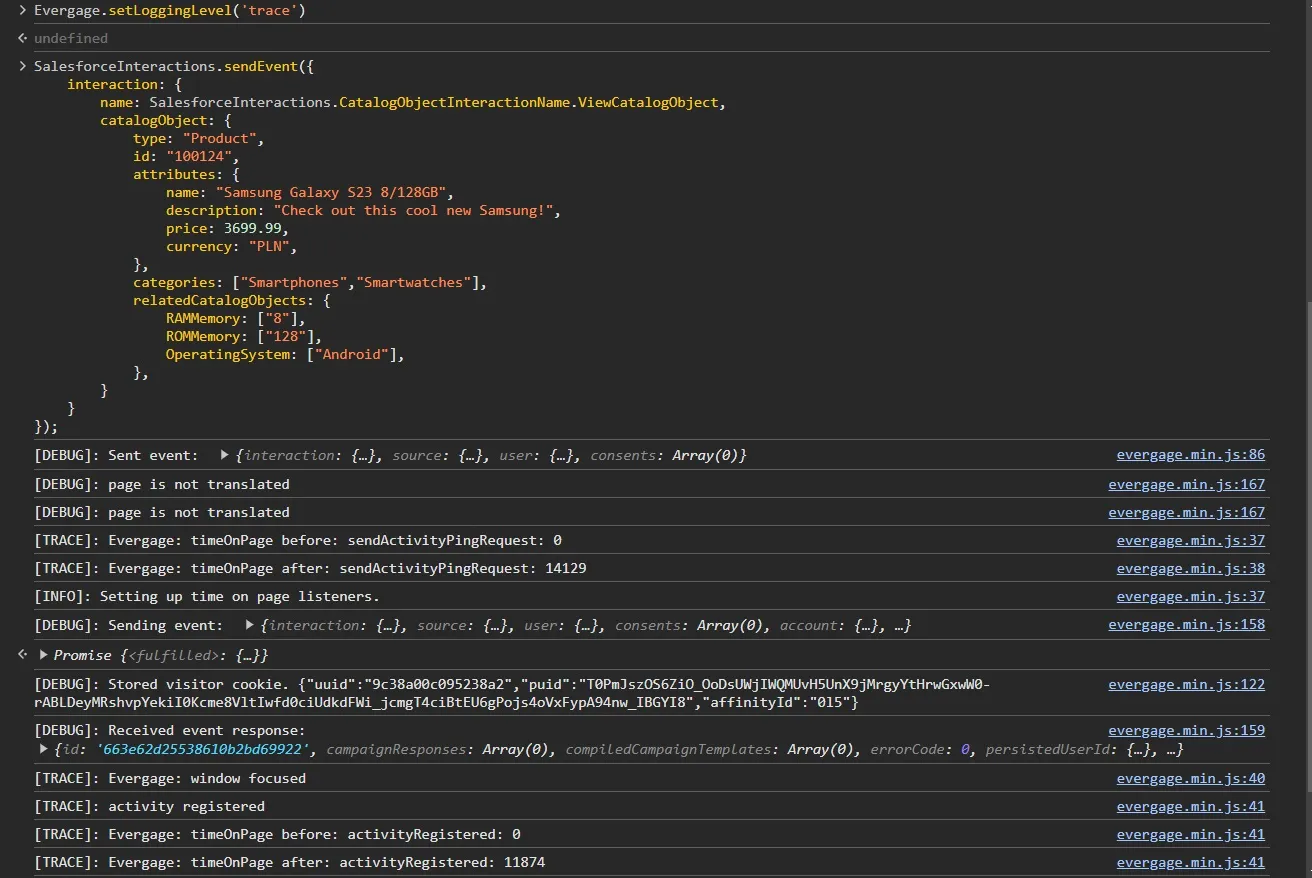
Evergage.sendEvent / SalesforceInteractions.sendEvent – a function that allows you to send events (also through the console), check how to send additional events within a console
.ULgsxr9g_ZPykWU.webp)
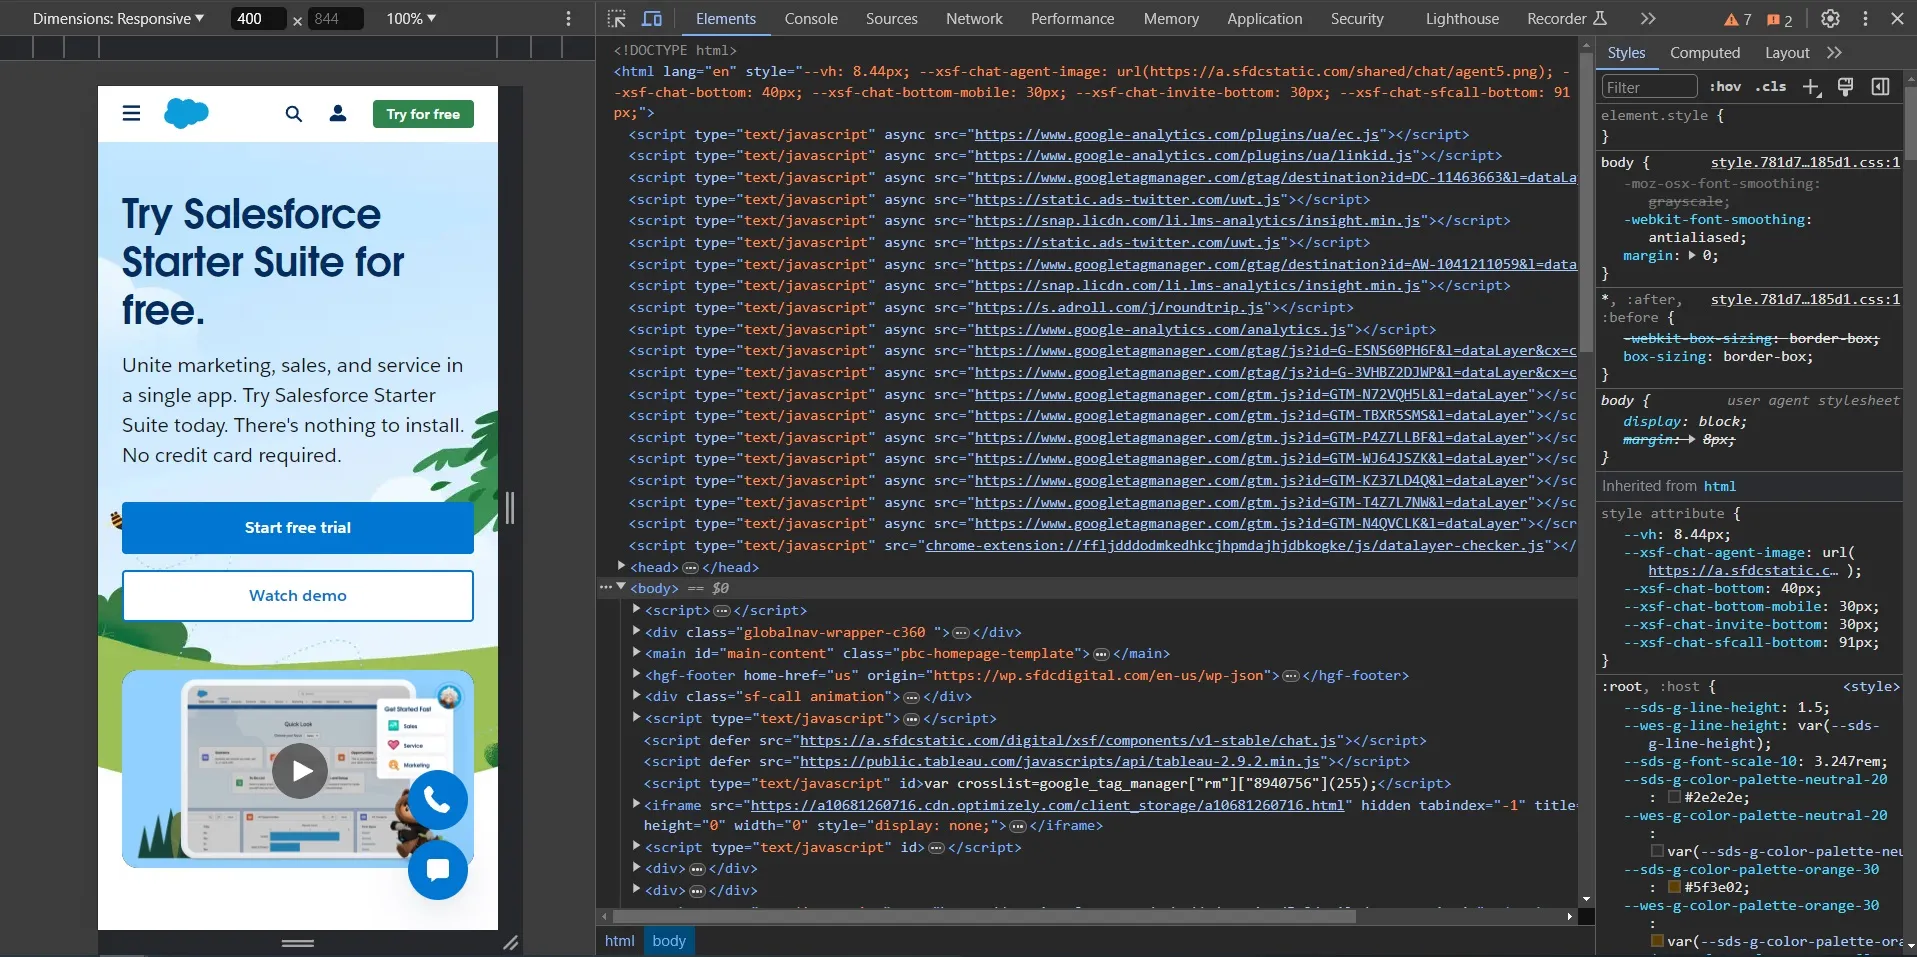
Checking the sitemap in the Sources
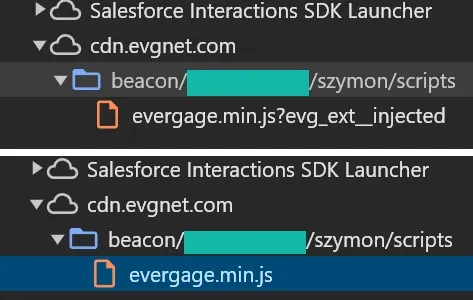
You can easily find your sitemap in the Sources tab in Developer Tools. Depending on how you have implemented the sitemap (injected or implemented script), you will have to find the cdn.evergage.com -> beacon/youraccount/yourdataset/scripts folder. The injected sitemap will have the evergage.js?evg_ext__injected.js file name, and the native will be called evergage.min.js.
In this file, you will find not only your sitemap but the whole Marketing Cloud Personalization code that is executed. Advanced developers should find here a lot of information on how the tracking is handled and extract more information about some exceptions.
At the end of this file, you will find your sitemap. Here you can, for example, see if your changes are loaded or not yet. What is more, you can use more interesting stuff, such as breakpoints.
Console breakpoints
Those who are more familiar with Developer Environments probably know the breakpoints. A breakpoint is an intentional stopping of the program to inspect the environment (data, variables, memory, logs, etc.). This option is also available in the DevTools.
To implement it, you have to find the sitemap in the Sources tab. Then, find the code that you want to interrupt and click on the specific line number. Now, when you refresh the site, if the sitemap execution goes through the code line with a breakpoint, the browser will stop it. And now the cool stuff begins.
Here you can not only check if the specific type of code was even triggered (useful with if statements) but also what are the variables and object current values. Now you can easily check if all the information is correct and find the issues.
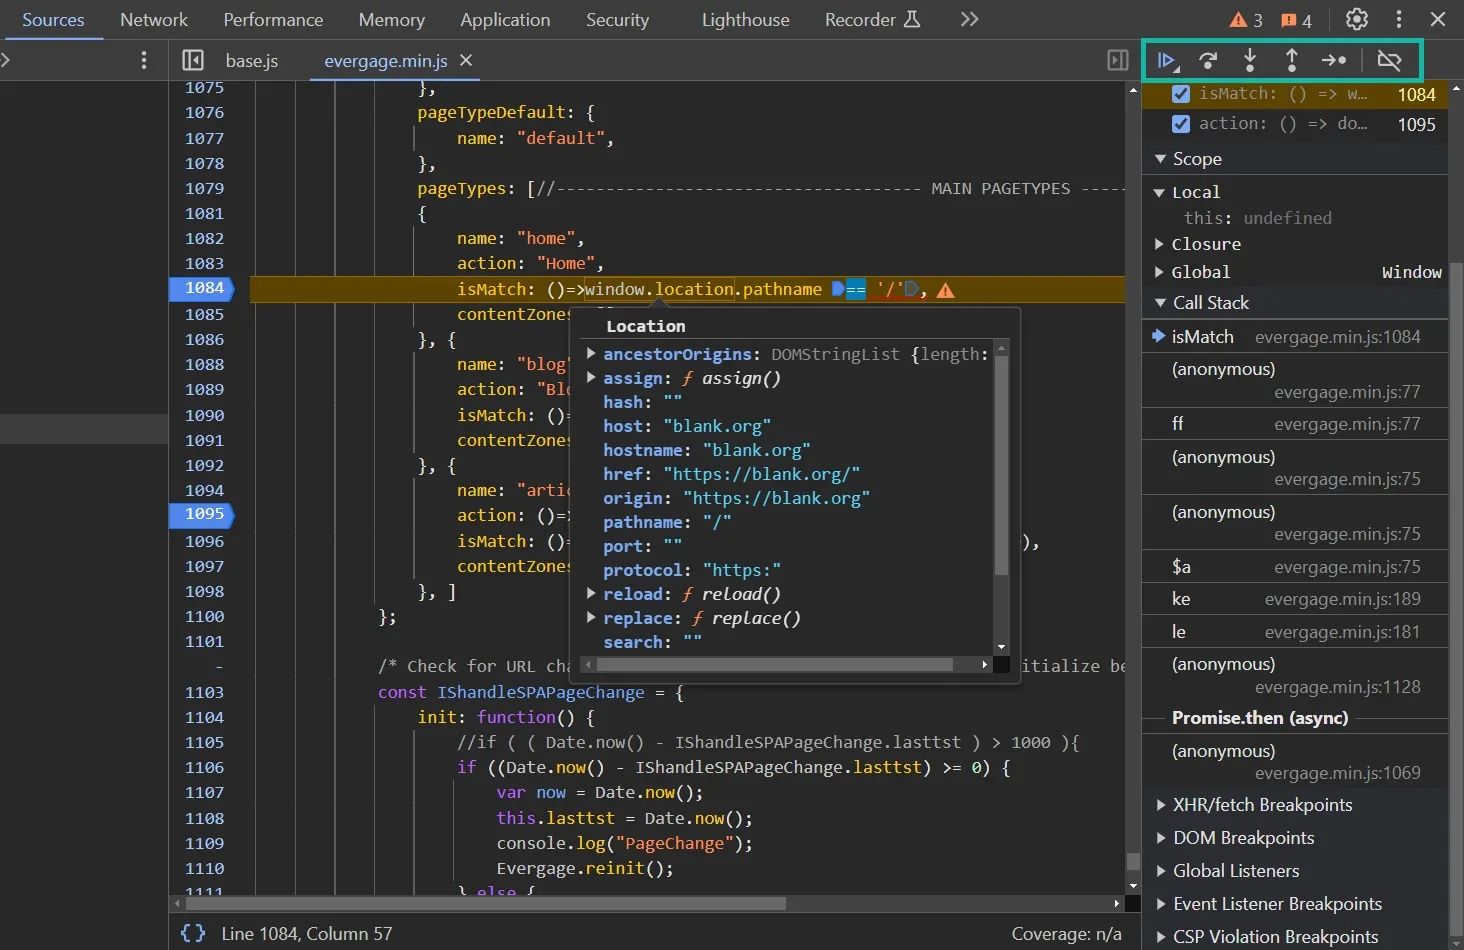
What’s more, on the page there will be a small menu (highlighted on the screenshot), where you can execute code to the next breakpoint (or to the end), step over the next function call, step into the next function call, step out of current function, step and deactivate the breakpoint. A perfect way to check how the sitemap works step-by-step.
⚠ There is an option that console breakpoints will not work with the Injected sitemap. To bypass this, see below how to load the sitemap without the plugin.
Load sitemap without WebSDK and plugin
Sometimes the plugin can be a little bit unpredictable when it comes to stability and catching the injected SDK. Also, there are scenarios when you haven’t got access to the Marketing Cloud Personalization or want to check or debug something on a different PC quickly. Or you want to debug the Injected sitemap and set up breakpoints that are moved to a different Evergage file.
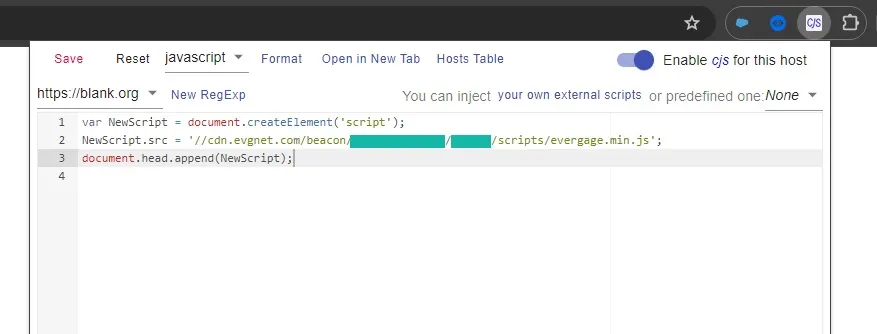
And there is a workaround here. If the Salesforce plugin injects the sitemap, why don’t we inject it with another tool? For example, using Custom Javascript For Website 2. After downloading the solution, open it and add the code:
var NewScript = document.createElement('script');
NewScript.src = '//cdn.evgnet.com/beacon/youraccount/yourdataset/scripts/evergage.min.js';
document.head.append(NewScript);
This will add the evergage.min.js file with your sitemap to the Sources. Now you can freely operate on the sitemap in the console and use breakpoints.
Debugging best practices
To sum up, we have a bunch of options to debug the Marketing Cloud Personalization Sitemap. If you are looking for a simple and low-code way to do it, use the Visual Editor. If you want to get the logs from the sitemap, use the setLoggingLevel option. If you want to build an ultra-overpowered environment for testing and debugging, use DevTools.
Good practice is to use the separate, dev dataset just for sitemap testing and debugging. This will prevent you from working on the production instance when each sitemap change will update the experience for each user that is on your webpage. Leverage it into your workflow.
Sometimes only the end user could trigger some edge case which will result in a sitemap error. In this scenario, if you want to operate on the production instance, you can execute the setLoggingLevel function directly in your browser console and leverage the breakpoints functionality to track the specific scenario.

Two heads are better than one. If you struggle with some specific case, just invite your colleague and debug together. Especially if you want to ensure that the error isn’t unique to you but also affects other users. You can also ask a question on Trailblazer Community Group.
Want to know more about Marketing Cloud Personalization? Check out more articles. You can also check my LinkedIn profile, where I post useful stuff. Feel free to follow me there. 😉
Read also: How to send user data from MCP to MC